Output: Hierarchical Model assuming common mortality
Posterior means, posterior standard deviations and 95%
credible intervals (Inference->Samples->stats)

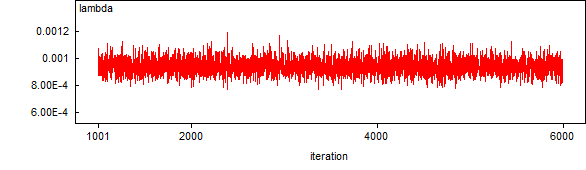
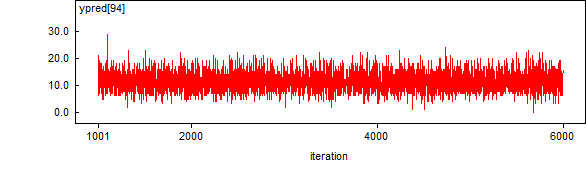
Sample path (history)
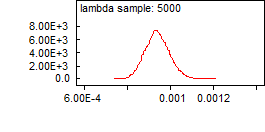
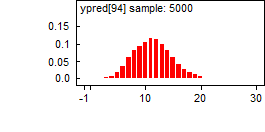
Posterior probability densities
(Inference->Samples->density)
(Further, right click on the figure->Margins->
Special…->Smooth -> change from 0.2 to 0.1-> apply all)
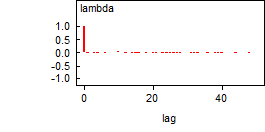
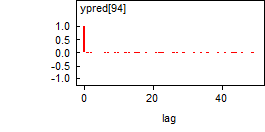
Sample autocorrelation function
(Inference->Samples->auto corr)
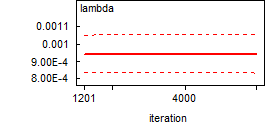
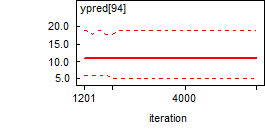
Running quantile plot
(Inference->Samples->quantiles)
Posterior predictive analysis. pleft:Pr(ypred[i] =< y[i]). pright:
Pr(y.pred[i]>=y[i])
Inference-> Compare-> node:pleft and click on caterpillar)
(Further, right-click on the figure, Property…->
Margins -> Special…-> check “rank” and showbaseline:0.05)
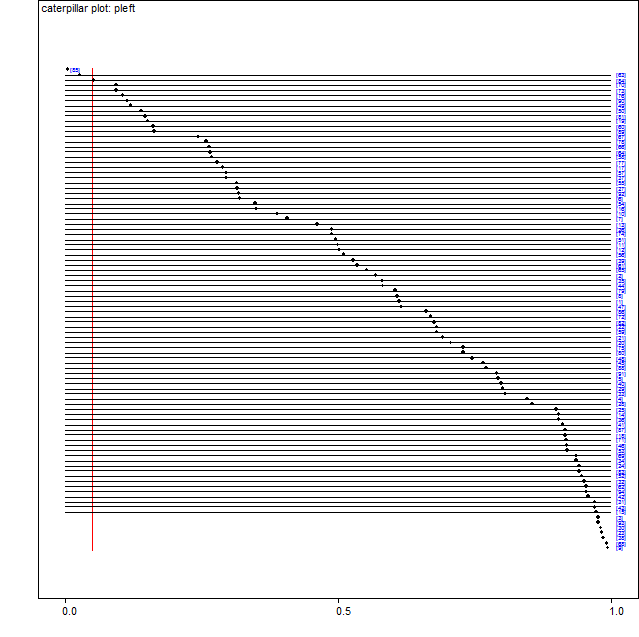
*P(ypred[85]<y[85])=0.0056 < 0.05
*P(ypred[63]<y[63])=0.0062 < 0.05
Inference-> Compare-> node:pright and click on caterpillar)
(Further, right-click on the figure, Property…->
Margins -> Special…-> check “rank” and showbaseline:0.05)
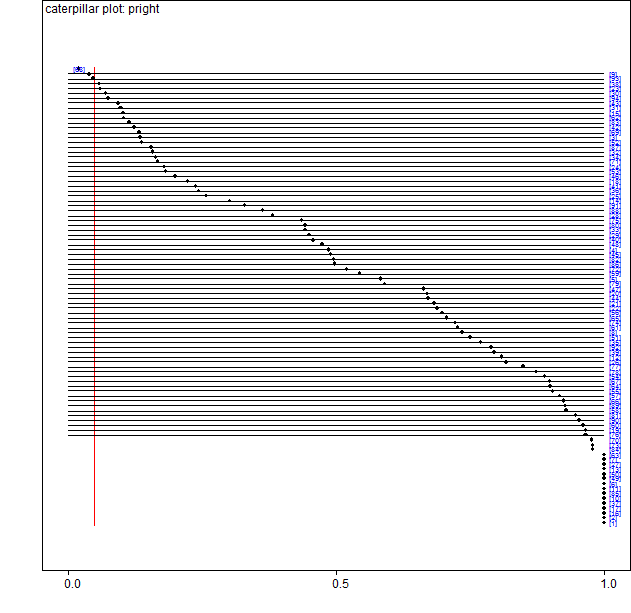
*P(ypred[68]>y[68])=0.0196 < 0.05
*P(ypred[9] > y[9] ) =0.0396 < 0.05
*P(ypred[93]>y[93])=0.0470 < 0.05